Google Docs introduces Pivot tables for Spreadsheets

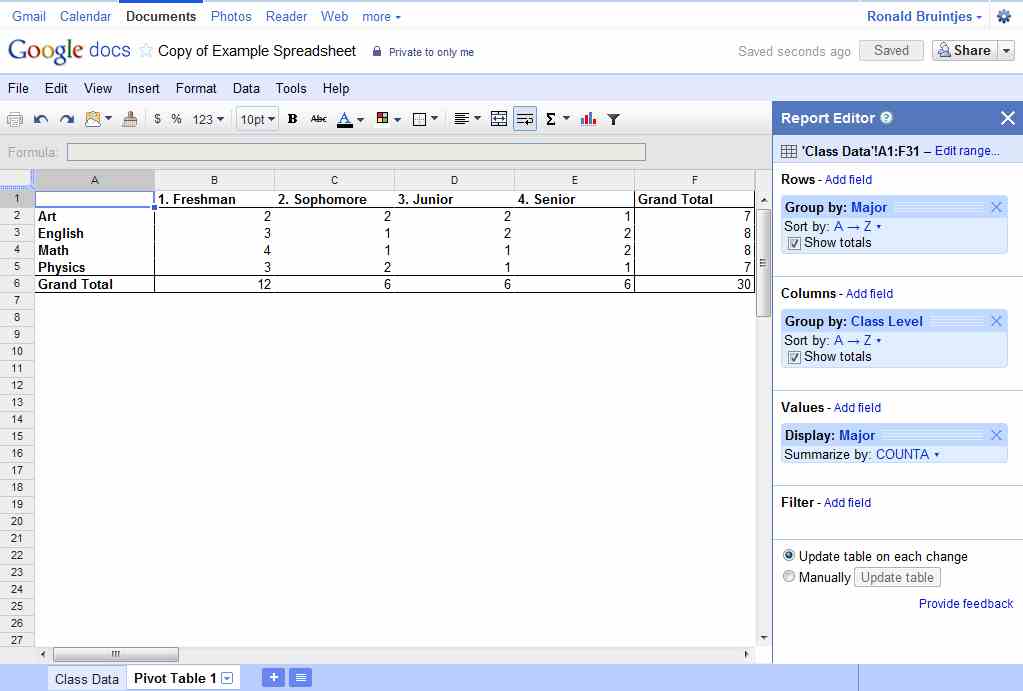
Recently Google Docs added Pivot Tables to the Spreadsheets type of documents, adding a powerful and much-needed feature.
It has most of the functionality PivotTables in Excel has: you can select columns and rows to display, how the data in the table is displayed (Sum, Average, Count), and add filters to it. All this is done with drop-downs and dragging fields around.
One feature I missed during my short forage through the pivot tables is the Collapse All/Expand All: when you have multiple fields selected on either rows or columns, creating a hierarchy, the higher level fields get a little + or - sign next to them. It appears impossible to collapse or expand all on a certain level, forcing you to do it one by one.
A step by step tutorial to Pivot Tables is available here. For those who need a visual to make it all understandable, Google provides a training video:
Note: the step by step tutorial explains how to add a filter to a pivot table, but uses fields that were not available in my version of the sample spreadsheet. Just add a filter on Major, and select Physics as the only value.